

 English
 français
 Deutsch
 español
 العربية
 中文
中文
Abstract: A utility operates feeder and substation capacitor banks on a 25.56kV distribution feeder. The utility uses frequency scan simulations to determine the effect of distribution feeder and substation capacitor banks on harmonic resonance and frequency response characteristics. It is assumed that the simulations will show that the frequency response characteristics of the feeder are very dependent on the status of the feeder and substation capacitor banks.
This case study evaluates the effect of substation and feeder capacitor banks on the frequency response characteristic of a 25.56kV distribution feeder.
The effect of distribution feeder and substation capacitor banks on harmonic resonance and frequency response characteristics was studied for the system shown in Figure 1. The accuracy of the system model was verified using three-phase and single-line-to-ground fault currents and other steady-state quantities, such as capacitor bank rated current and voltage rise.
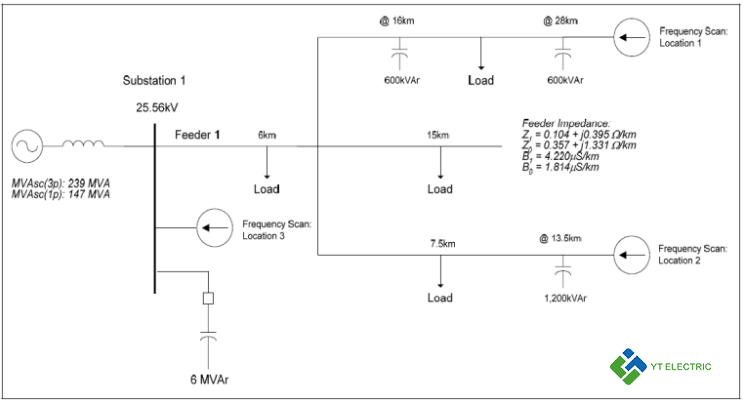
Figure 1 – Oneline Diagram for the Feeder Resonance Case Study
Frequency scan analysis was used to determine the impedance vs. frequency characteristic for the circuit for various operating conditions. The frequency range for these cases was 60 Hz to 5,000 Hz (1 Hz increment). The load on the feeder for the full load condition was approximately 10.4 MVA at 98% power factor in the power system. The following frequency scan cases were completed:
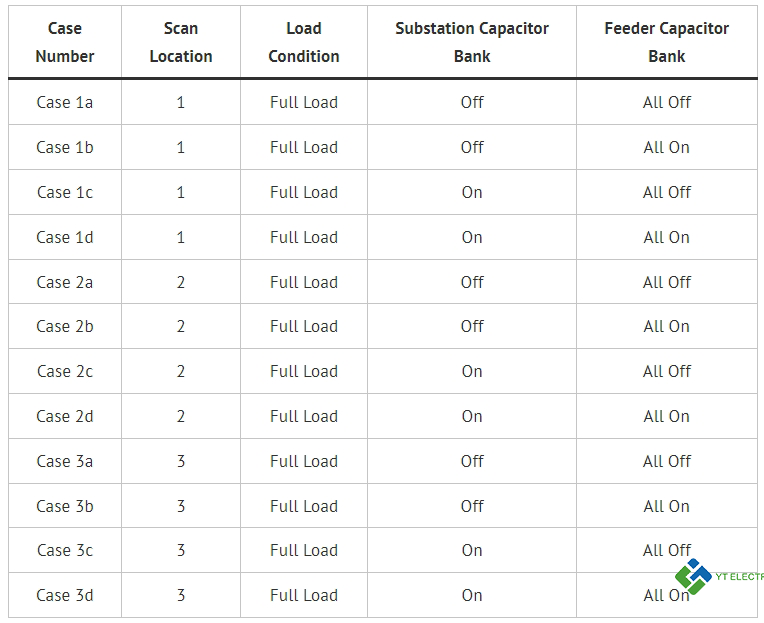
Figure 2 shows the impedance vs. frequency simulation results for scan location number 1 for the four operating conditions.
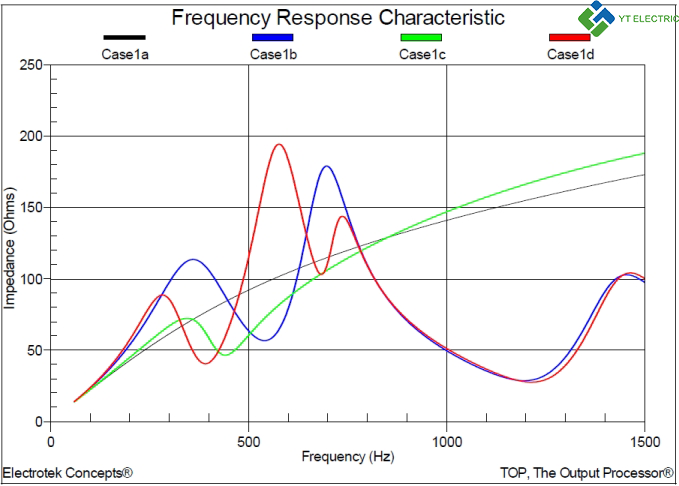
Figure 2 – Frequency Response at Scan Location Number 1
Figure 3 shows the impedance vs. frequency simulation results for scan location number 2 for the four operating conditions.
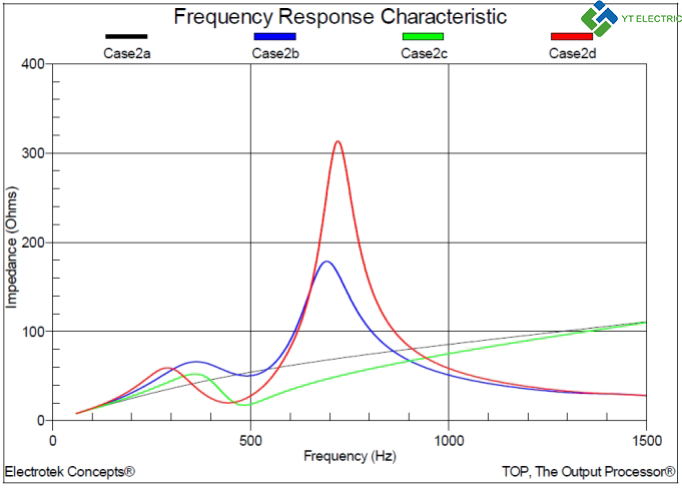
Figure 3 – Frequency Response at Scan Location Number 2
Figure 4 shows the impedance vs. frequency simulation results for scan location number 3 for the four operating conditions.
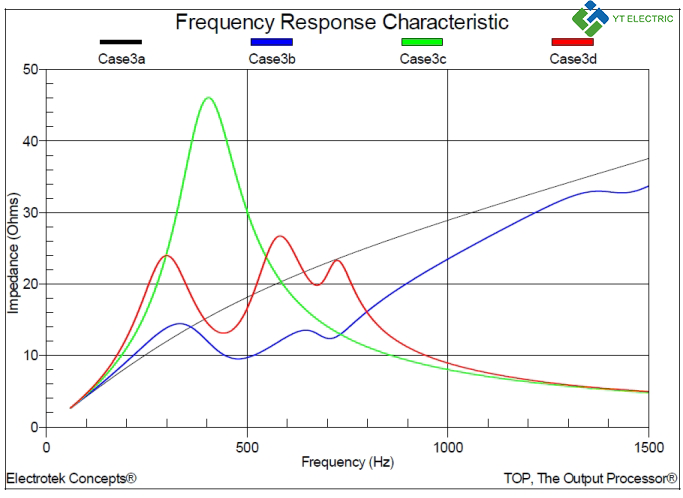
Figure 4 – Frequency Response at Scan Location Number 3
The simulations show that the frequency response characteristics of the feeder are very dependent on the status of the feeder and substation capacitor banks. Additional observations include:
1. For scan locations number 1 and number 2 (end of feeder segments), the simulated frequency response is generally more severe for the condition of having the smaller distributed feeder capacitor banks in service as compared to having the larger substation capacitor bank in service.
2. For scan location number 3 (substation bus), the simulated frequency response is generally more severe for the condition of having the larger substation capacitor bank in service as compared to having the smaller distributed feeder capacitor banks in service.
3. It is often difficult to generalize the effect on voltage distortion levels when the location and characteristics of the harmonic producing loads are not known. The resulting voltage distortion for the different operating conditions will depend on the locations, ratings, and characteristics of the various nonlinear loads on the circuit. For example, if the nonlinear loads are near the ends of two feeder segments (scan locations 1 and 2), it is likely that the feeder voltage distortion will be somewhat higher for the condition of having the feeder capacitors in services. However, if the nonlinear loads are near the substation (scan location 3), it is likely that the feeder voltage distortion will be somewhat higher for the condition of having the larger substation capacitor bank in service. Actual current and voltage distortion levels may be determined by field measurement and/or more detailed computer simulations that include the harmonic current source characteristics.


 IPv6 network supported