

 English
 français
 Deutsch
 español
 العربية
 中文
中文
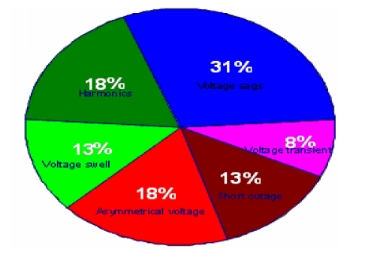
The name power quality has become one of the most productive concepts in the power industry since late 1980s. Power quality is the “Degree to which both the utilization and delivery of electric power affects the performance of electrical equipment”.Power quality is decided by magnitude of voltage and frequency. Voltage quality problem is divided into under voltage, overvoltage, interruption, voltage sag, voltage swell and so on, and frequency quality problem could be classified into frequency variations, transient, harmonics, etc.
Voltage sag lasting for a few cycles result in losses of several million dollars includes:
The magnitude of voltage and the frequency are the parameters that specify the voltage sag:
Based on the phases affected during the sag, the voltage sag has been classified into three types:
There are two methods for classification the three phase voltage sags i) ABC Classification (First method) ii) Symmetrical Components (Second method). Due to simplicity, first method is more used than the symmetrical components classification. However, this classification is based on a simplified model of the network and it is not recommended to use for the classification of voltage sags obtained from measured instantaneous voltages.
This is generally determined by power quality curves, a plot of voltage magnitude versus time. Power quality curves represent the intensity and duration of voltage disturbances. The Computer and Business Equipment Manufacturers’ Association (CBEMA), and Semiconductor Equipment and Materials Institute (SEMI) have published information defining what levels of poor power quality, specifically voltage sag, equipment should be able to tolerate. Other power quality curves in common use today were developed by the American National Standards Institute (ANSI) and the Information Technology Industry Council (ITIC).
The ANSI curves plot the deviation from nominal voltage as a percentage of nominal voltage compared to the duration or the maximum length of time the voltage is permitted to reach. For example, the limit for voltage occurrences greater than 1 second duration might be ± 10%. The ITIC and CBEMA curves also plot voltage with respect to duration, but as a percentage of absolute voltage. Electronic equipment can typically withstand high voltages provided they last for less than 1 millisecond in duration, but voltages greater than +10% or -20% for between 0.5 seconds and 10 seconds duration are to likely create problems.
ITIC also shows that computer equipment should be able to ride through short-duration voltage sags, if the voltage doesn’t go below 70%. For sags of longer duration, voltages below 80% could affect the equipment. Even SEMI F47 semiconductor industry standard specifies an improved voltage sag ride-through for process tools. It requires a ride-through down to 50% voltage for 200 milliseconds, which will significantly reduce the number of voltage sags that may cause process disruptions in semiconductor plants. These curves are merely guidelines, and some electronic equipment may require higher power quality conditions than those represented in these standards.
PQ indices are key issue to indicate the different performance experienced at the transmission, sub-transmission, substation and distribution circuit levels. There are various ways of presenting voltage sag performance.
The most common index use is the SARFI. This index represents the average number of voltage sags experienced by a end user each year with a specified characteristic. For SARFI_X, the index would include all of the voltage dips where the minimum voltage was less than X(where X is a number between 0 and 100) gives the number of events with a duration between 10 milliseconds and 60 seconds and a retained voltage less than X%. SARFI_70 gives the number of events with retained voltage less than 70% [17, 18]. Standard voltage thresholds are 140, 120, 110, 90, 80, 70, 50, and 10 % of nominal.
Voltage sag is an unavoidable phenomenon in power systems, primarily caused by faults within the network. The impact of voltage sag has become increasingly significant due to the economic consequences, particularly for industrial consumers. Even brief interruptions can disrupt sensitive equipment and harm essential operations in modern society. As a result, it is vital to understand the characteristics, types, occurrence, and potential damages caused by voltage sags. Awareness of these aspects, combined with strategies like analyzing sag curves and indices, can help in reducing the impact of voltage sags.
One effective approach to mitigating voltage sags is the installation of equipment designed to stabilize voltage levels. YT Electric's Static Var Generators (SVGs) offer an advanced solution to combat voltage sags and other power quality issues. By dynamically adjusting reactive power in real-time, our SVGs help maintain voltage stability, ensuring that critical industrial processes are protected from the damaging effects of voltage sags. This not only enhances operational reliability but also reduces downtime and associated costs, making SVGs a valuable addition to any power system seeking improved performance and protection against power quality disturbances.


 IPv6 network supported